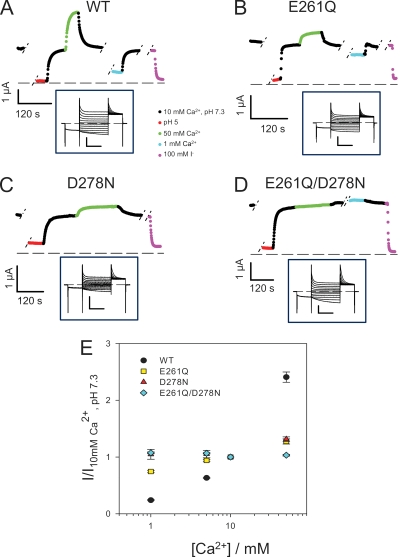
Figure 6.
Effect of [Ca2+]ext on ClC-Ka WT and its mutants E261Q, D278N, and E261Q/D278N. (A–D) The mean current, shown in color, at 60 mV plotted as a function of time. The type of solution applied is color coded as indicated in the middle inset. Breaks during the experiment are indicated with short dashed lines. Insets display representative current traces evoked by the standard IV-pulse protocol in standard solution. Horizontal bars, 100 ms; vertical bars, 3 µA. (E) Dose–response relationship of the modulation by Ca2+ of ClC-Ka WT (black circles; n = 16) and the mutants E261Q (yellow squares; n = 4), D278N (red triangles; n = 5), and E261Q/D278N (light blue rhombi; n = 5). Currents at 60 mV were normalized to values measured in standard solution and plotted versus [Ca2+]ext. Data for WT are different compared with Fig. 1 because they were obtained from different oocytes as control measurements in the mutagenic screen. The currents shown for the mutants D278N and E261Q/D278N are from oocytes with exceptionally large expression. On average, the current expression level measured at 60 mV were (in µA ± SD [no. of oocytes]): WT (2 d), 2.5 ± 1.4 (7); WT (3 d), 5.3 ± 1.9 (8); E261Q (1–2 d), 4.3 ± 0.9 (4); D278N (>3 d), 1.1 ± 0.9 (8); E261Q/D278N (>3 d), 2.2 ± 0.9 (7); E261Q/D278N/H497M (>3 d), 0.8 ± 0.3 (15); not injected, 0.17 ± 0.07 (8).

