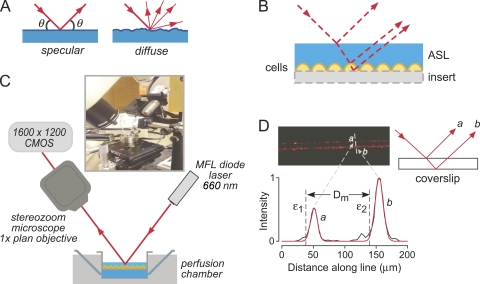
Figure 1.
Principle and instrumentation for ASL depth measurement by SLRM. (A) Schematic showing light paths for diffuse versus specular laser reflections. (B) Schematic of incident, reflected, and refracted light paths for a fluid layer overlying cells on a culture insert, showing displacements of reflections from interfaces. (C) Diagram and photograph of SLRM apparatus. (D) Image of laser reflections from a cover glass (thickness, 0.1 mm; air–glass interface) (top left) with schematic showing origin of reflections a and b (top right). Intensity versus distance profile shown in black (bottom) with fitted Gaussian curves (red) at each interface. ε1 and ε2 are calculated locations of interfaces, and Dm is the distance between interfaces (cover glass thickness).

