Figure 3.
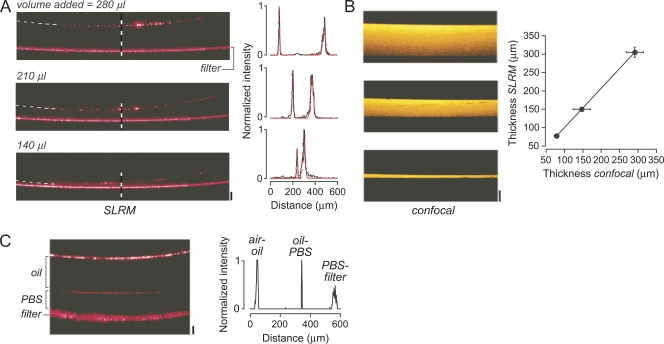
Surface reflections from fluid layer and cell culture insert interfaces. (A; left) SLRM images of a polycarbonate cell culture insert containing different volumes (140, 210, and 280 µl) of deposited PBS. Top reflection corresponds to air–liquid interface and bottom reflection to liquid–filter interface. Bar, 100 µm. Horizontal width of image is 2.5 mm. (Right) Corresponding intensity versus distance profiles (black) at locations of dashed vertical lines, with fitted Gaussians (red). (B; left) Corresponding confocal z-scans. Bar, 100 µm. Horizontal width is 236 µm. (Right) Fluid layer thickness measured by SLRM against that measured by z-scanning confocal microscopy. Mean ± SEM of three measurements (r2 = 0.99). (C; left) SLRM image of oil layer above PBS fluid layer on a polycarbonate insert. Bar, 100 µm. (Right) Corresponding intensity versus distance profile.

