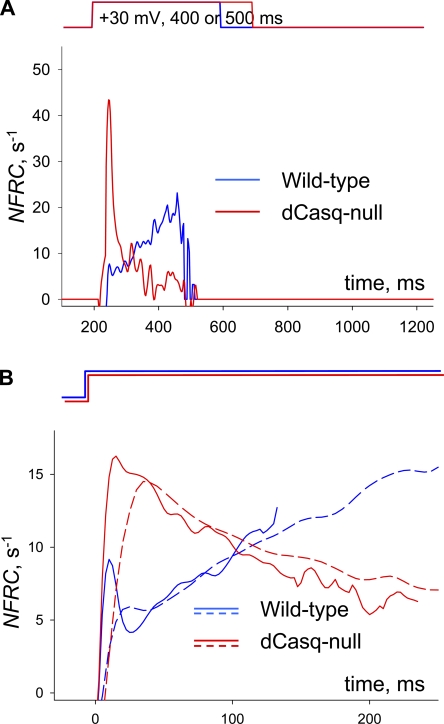
Figure 3.
Evolution of evacuability in WT and dCasq-null cells. (A) The NFRC, an index approximately equal to E (see Materials and methods) calculated for the example images of Fig. 2. The NFRC is ill-defined if is close to zero. We stop its calculation when reaches a (low) threshold of 1 mM/s, which occurs by ∼300 ms in these examples. (B) Averages of NFRC(t) over all WT and null cells subjected to long duration pulses. Two acquisition frequencies were used to allow for different pulse durations in images of the same digital format. For averaging, the traces were grouped by frequency (solid, 2.5 ms/line; dashed, 5 ms/line) and aligned to the beginning of the pulse. Averaging was extended to the first time when reached threshold in any individual record. Except at the beginning of the pulse, when NFRC changes rapidly and is not a good measure of E (Materials and methods), the properties of the averages do not depend on scanning frequency. The averages generally reproduce the evolution of the individual examples in A.

