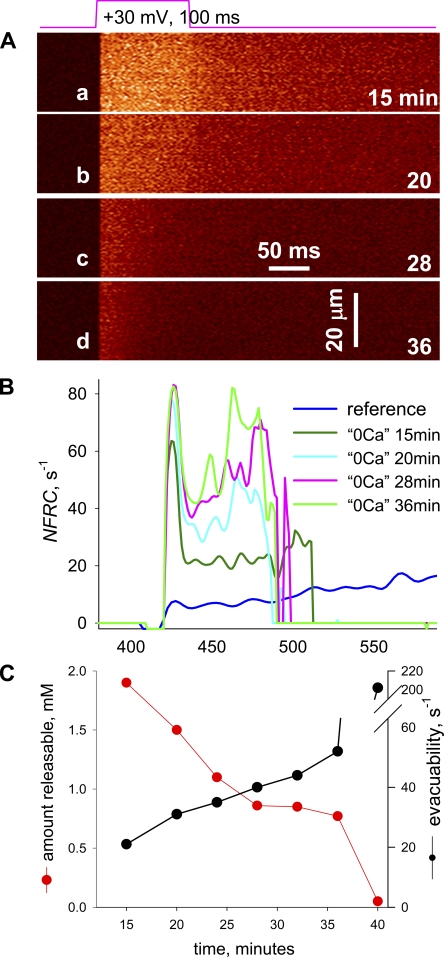
Figure 5.
The evolution of evacuability in a cell exposed to 0 Ca. (A) Line scans of fluorescence in a WT cell exposed to 0 Ca. Times of exposure are given, in minutes, at the bottom right corner of every panel. (B) NFRC for images in A. In blue is NFRC for a WT cell in reference solution (same as in Fig. 2). Images for the cell in 0 Ca were acquired at a higher frequency, hence the initial peak in NFRC, which is blunted in the reference record. Although NFRC increases with time of exposure, the interval when it is defined becomes shorter, a direct result of the increase in E. (C) Black symbols, evacuability, calculated for images in A and other images as an average of the NFRC in the first 20 ms after the initial peak (the initial peak is excluded because a rapidly changing NFRC ceases to be a good approximation of E). Red symbols, total releasable amount of calcium, R(∞), plotted versus time of exposure to 0 Ca. Note the inverse dependence between evacuability and amount releasable. ID, 092409b. Reference is 021408a_25.

