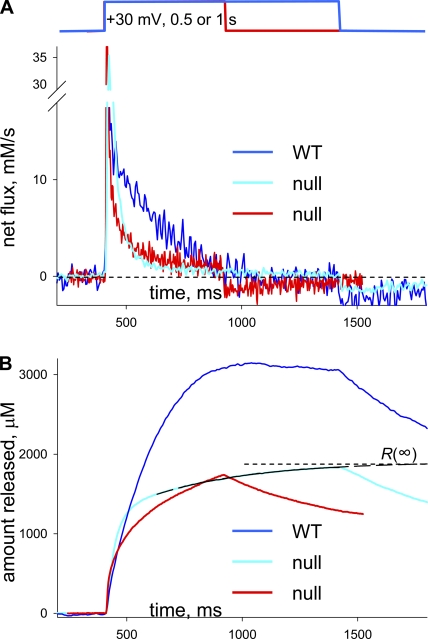
Figure 7.
Substantial releasable Ca2+ remains in dCasq-null cells. (A) calculated (Eq. 6) for a WT cell (blue) and a dCasq-null cell (cyan) subjected to a 1-s–long depolarization, and the dCasq-null cell of Fig. 2 (red). is similar to but tends to 0 during the pulse and becomes negative afterward. It therefore shows similar kinetic differences between WT and null cells. (B) Net amount of Ca2+ released, R(t), calculated (by Eq. 7) for the fluxes in A. The records illustrate that null cells may release substantial amounts of calcium (see Table II for averages). They also show that R(t) typically reaches its maximum, R(∞), much sooner in the WT. For the case represented by the cyan curve, R(t) did not quite reach maximum, and R(∞) was calculated as the asymptote to the curve in black, an exponential fit to the last 700 ms of R(t) during the pulse. R(∞) could not be reliably established for the release record represented in red. ID: WT, 101906b_31; nulls, 082108c_14 (cyan) and 020609b_3 (red).

