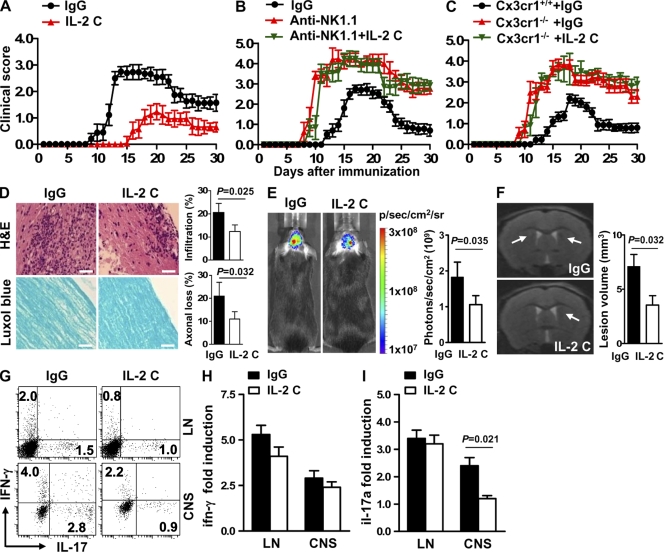
Figure 4.
IL-2 complexes attenuate EAE and silence Th17 cell responses in the CNS. (A) Effect of IL-2 complexes on the development and progression of EAE. n = 12–16/group. Data are pooled from three independent experiments. P < 0.01 between days 9 and 21 and P < 0.05 between days 22 and 30 (Mann-Whitney U test). (B and C) Effects of IL-2 complexes on the development and progression of EAE in mice that received anti-NK1.1 mAb (B; n = 8/group) or in Cx3cr1−/− mice (C; n = 8–12/group). Data are pooled from two independent experiments. Error bars represent the means ± SEM. P > 0.05 for any time point (Mann-Whitney U test). (D) Cellular infiltration (top) and demyelination (bottom) were analyzed using CNS sections harvested from days 12–20 after immunization. Bars, 100 µm. (E) Visualization and quantification of brain inflammation by in vivo bioluminescence imaging at day 15 after immunization. (F) In vivo MRI brain images of mice treated with IgG or IL-2 complexes (IL-2 C) showed a decrease in inflammation and demyelination in IL-2 complex–treated mice. Focal lesions (arrows) were located around the lateral ventricle in IgG-treated mice and increased signal intensity on T2-weighted lesions, which were attenuated in IL-2 complex–treated mice. Data from D–F are representative of two independent experiments (n = 4–6/group). Error bars represent the means ± SEM. P-values were determined by a Student’s t test. (G) Lymphoid or CNS cells were restimulated with MOG overnight, and IFN-γ– and IL-17–expressing CD4+ T cells were measured by intracellular staining. (H and I) qRT-PCR of IFN-γ and IL-17 transcripts from sorted CD4+ T cells. Data from G–I are representative of four independent experiments (n = 6–12/group). Error bars represent the means ± SEM. P-values were determined by a Student’s t test.

