Figure 6.
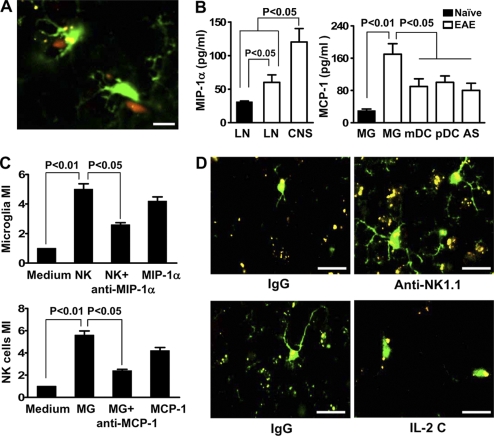
Reciprocal chemoattraction between NK cells and microglia. (A) Colocalization of NK cells and microglia. Cx3cr1GFP+/− mice were immunized with MOG/CFA, brain tissues were harvested during days 12–20 after immunization, and CNS sections were made. NK cells and GFP+ microglia (green) were visualized with anti-NK1.1 or -NKp46 (red). Representative images of four independent experiments with four mice per group each are shown. Bar, 10 µm. (B, left) MIP-1α release by 2 × 10⁵ NK cells isolated from lymph node (LN) of naive or MOG-challenged mice and from the CNS during the peak of EAE in mice. (B, right) MCP-1 release from 2 × 10⁵ CNS-derived APCs isolated during the peak of EAE. Chemokines were detected by ELISA in cell culture supernatant of the corresponding cells without stimulation. Results are representative of three similar experiments in which cells from 15–20 perfused donor mice were pooled and each APC subset was analyzed three times. Error bars represent the means ± SEM. P-values were determined by an ANOVA test. (C, top) CNS-infiltrating NK cells recruit microglia in an MIP-1α–dependent manner. NK cells induced a substantial recruitment of purified microglia in transwell experiments. Medium only was used as a control. Anti–MIP-1α antibody or MIP-1α was added as indicated. 2 × 10⁵ microglia were added to the upper chamber. (C, bottom) Supernatants from microglia recruit NK cells in a MCP-1–dependent manner. Chemotaxis of purified CNS-infiltrating NK cells toward chemokines produced by microglia was tested by using a transwell assay. Supernatants collected from purified microglia were stimulated with PMA and were added to the lower chambers of transwell plates. Medium only was used as a control. Anti–MCP-1 antibody or MCP-1 was added as indicated. 2 × 10⁵ NK cells were added to the upper chamber. Specific migration was calculated as migration index. Bars represent means of triplicate wells from a representative of three independent experiments. Error bars represent the means ± SEM. P values were determined by a Student’s t test. (D) Morphological features of microglia and their proximity to inflammatory foci when NK cells are manipulated. Cx3cr1GFP+/−, Cx3cr1−/−, and Cx3cr1+/+ mice, with microglia labeled with GFP, were immunized with MOG/CFA. A portion of the +/− mice was treated with control IgG, anti-NK1.1 mAb, or IL-2 complexes. Brain tissues were harvested during days 12–20 after immunization. Morphological features of microglia in relation to NK cells were analyzed by confocal microscopy. Activated microglia (increased size of cell body and thickening of proximal processes) were noted at a higher prevalence in control mice. A significantly higher level of reactive oxygen species (ROS; denoting areas of inflammation) was noted in NK cell–deleted mice, whereas the IL-2 complex treatment group had a lower level of ROS compared with control mice. Representative images of three independent experiments with four mice per group each are shown. Bars, 10 µm.

