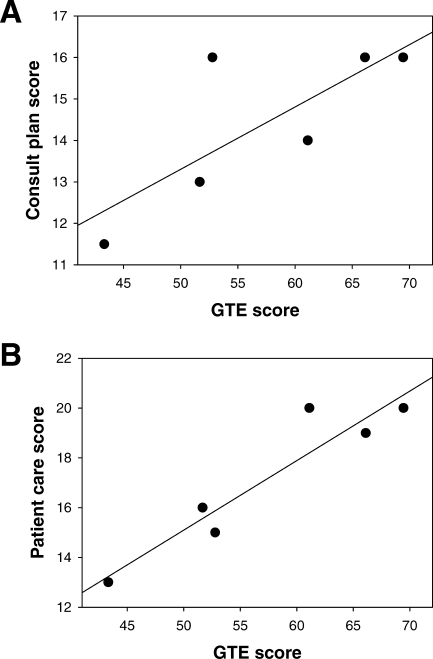
Figure.
Association Between the Results of the</emph> Gastroenterology Training Examination (GTE) and Faculty Medical Knowledge and Patient Care Checklist Scores
Panel A displays a plot of the score received on the “plan” component of the consultation note checklist versus the trainee's GTE score. The solid line reflects a linear fit of the data (r2 = 0.604). In panel B, GTE scores are plotted against the trainee's faculty checklist score (r2 = 0.886).

