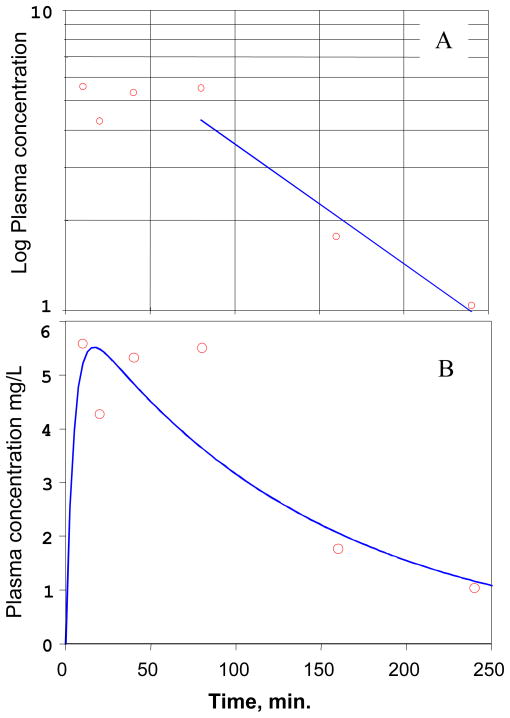
Figure 5.
PK modeling of the experimental data for cyclopropavir (5) after IV bolus injection of prodrug 6 in mice ( observed,
  predicted). A, Single compartment first order elimination modeling: Logarithmic plot of the average plasma concentration of cyclopropavir (5) vs. time. The straight line is the linear regression fit to the last three data points (1/Y weighting), which was used to estimate the terminal elimination rate constant β. B, Two compartmental analysis. See text for model description.

