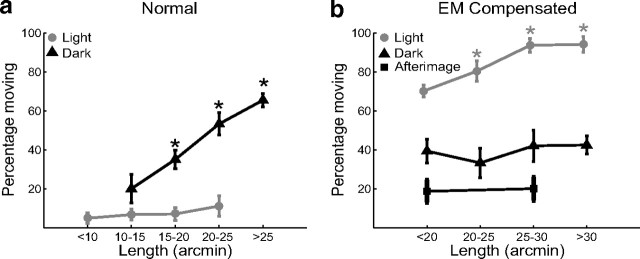
Figure 2.
Influence of ocular drift on the perceived motion of a stationary stimulus. Percentages of moving responses are shown as a function of drift length in the normal condition, when the dot was stationary on the monitor (a); and under retinal stabilization, when the dot was stationary on the retina (b). Data obtained both in the dark (black lines) and under dim illumination (gray lines) are reported. Since the duration of stimulus presentation was constant, the length of ocular drift is also proportional to its speed. The results of a control experiment in which two observers examined the motion of an afterimage are also shown. Error bars represent 95% confidence intervals. Asterisks mark significant differences with respect to the leftmost point in each curve (p < 0.05; Bonferroni-corrected one-tailed z-test).

