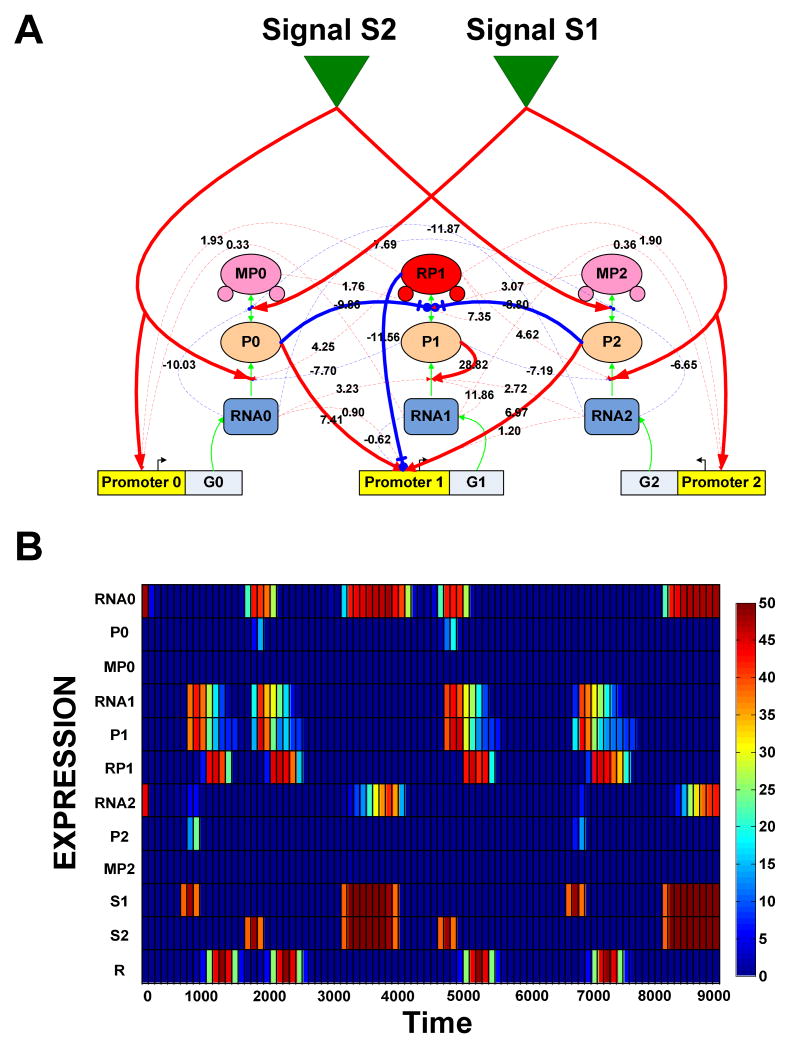
Figure 4. Network topology and expression profiles of molecular components.
(A) The regulatory network of an organism evolved under low mutation-rate within a delayed dynamic XOR environment. Each node represents either mRNA/siRNA (RNA), protein (P) or modified protein (MP). The environmental resource harvested at each time point is proportional to the number of response protein molecules (red RP1 node) and resource abundance at the time. Regulatory interactions can be positive (activating – red arrows) or negative (repressing – blue arrows). Solid lines represent essential links. (B) Expression profile of all nine nodes, environmental signals (S1 and S2) and resource (R) during two epochs (9000 time units). The color-bar refers to the number of molecules present.

