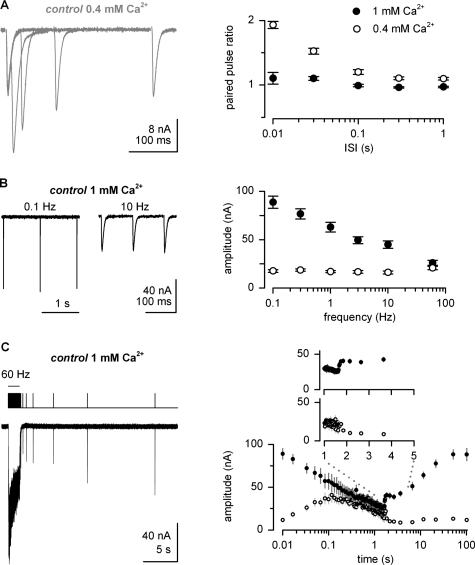
Figure 1. Measurements of short-term plasticity.
(A) Superimposed EPSCs recorded in TEVC mode in response to paired-pulse stimulation in 0.4 mM [Ca2+]e and average paired-pulse ratios plotted against interstimulus intervals (ISI; filled symbols: 1.0 mM [Ca2+]e, n=9 (Kittel et al., 2006b, open symbols: 0.4 mM [Ca2+]e, n=8). (B) Examples of steady-state EPSCs and summary of average amplitudes versus frequency (1 mM [Ca2+]e, n⩾10 (Kittel et al., 2006b), 0.4 mM [Ca2+]e, n=6). (C) Example of 100 stimuli applied at 60 Hz followed by stimuli at increasing intervals. The stimulation protocol is illustrated above the current trace (left). The average peak amplitudes are plotted on a logarithmic time scale (1 mM [Ca2+]e, n=6, 0.4 mM [Ca2+]e, n=5). Inset: average EPSC amplitudes plotted on a linear time scale to illustrate the initial phase of recovery. In 1.0 mM [Ca2+]e, recovery after the train is biphasic whereas in low [Ca2+]e EPSC amplitudes decrease during the first 100 ms after the train.

