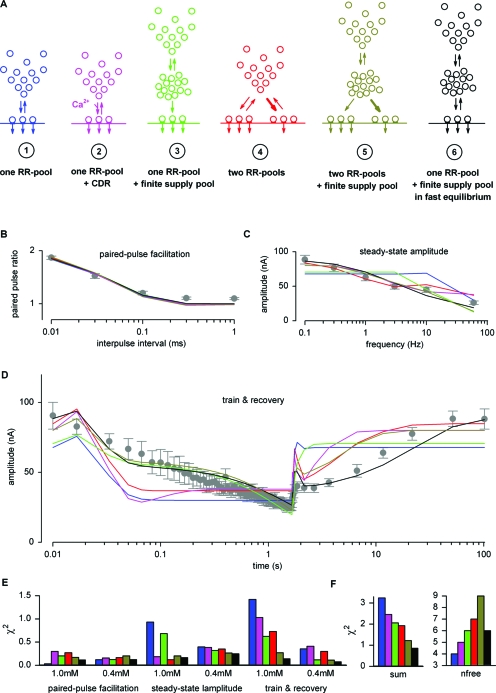
Figure 2. Comparison of mechanistic models of short-term plasticity.
To investigate the mechanisms underlying STP, we compared different vesicle pool models. (A) Simple schemes of six models (for more details, see Supplementary Fig. S1). Note the color code used hereafter. Average values for PPF (B) in 0.4 mM [Ca2+]e, SSL (C), and train plus recovery (D) experiments in 1.0 mM [Ca2+]e superimposed with model predictions (note that the models also had to fit the corresponding STP experiments in 1 and 0.4 mM [Ca2+]e). The free parameters of each model were optimized to give the best description of the experimental findings (see Supplementary Table S1 for values). (E) The deviation of predictions from the experimental data is plotted as χ2 for each set of experiments and for each model. (F) Sum of all six χ2-values and the number of free parameters used by each model.

