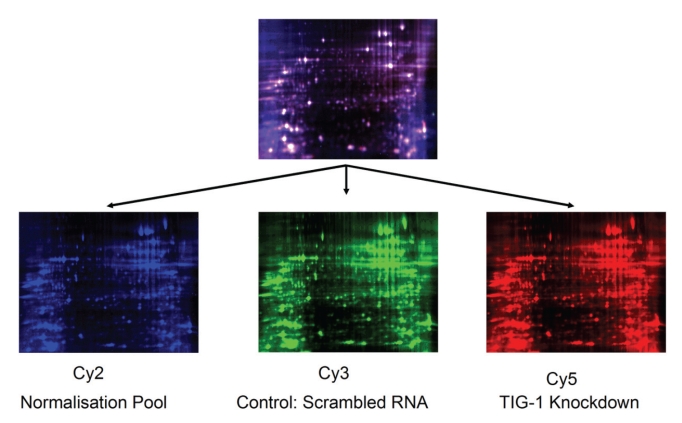
Figure 1.
DIGE data: Representation set of one of the 4 biological replicates. 25 µg of control PWR-1E cells lysates labeled with 200 pmoles of Cy3 (green); 25 µg of RARRES1 knock-down PWR-1E cells labeled with 200 pmoles of Cy5 (red) and a normalization pool composed of a 50:50 mixture of sample and control labeled with Cy2 (blue). The first dimension separation was performed on a 24 cm non-linear IPG strips and the second dimension separation was accomplished on a 5-20% gradient polyacrylamide gel with 2 built-in spot picking references. Gels were scanned at a 100 µm resolution using excitation and emission wavelength that corresponds to each dye. Combined Cy2, Cy3, and Cy5 signals are represented in the top gel.

