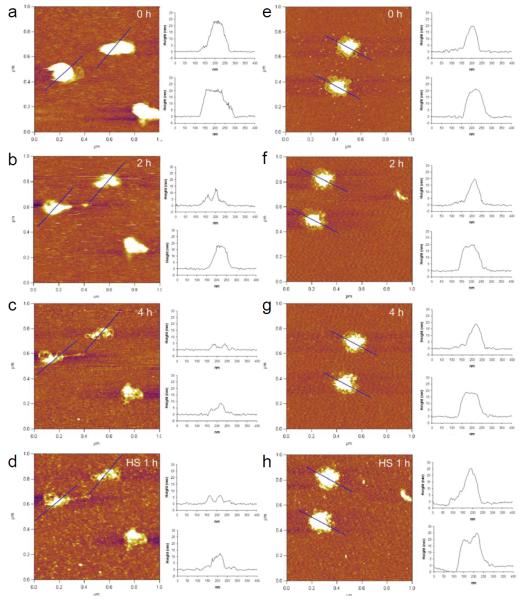
Fig. 3.
In situ AFM images of DNA/KL-PEI polyplexes (a-d) and DNA/KB-PEI polyplexes (e-h). DNA/KL-PEI polyplexes (a-c) and DNA/KB-PEI polyplexes (e-g) were hydrolyzed in pH 5.0 acetate buffer containing 150 mM NaCl for different periods of time. After hydrolysis, the acidic acetate buffer was replaced with heparan sulfate (HS) solution containing 150 mM NaCl. DNA/KL-PEI polyplexes (d) and DNA/KB-PEI polyplexes (h) were incubated in the HS solution for 1 h. Cross-sectional profiles along the blue lines in the AFM images are represented. All images are 1 × 1 μm2 in scan size and 6 nm in z range.

