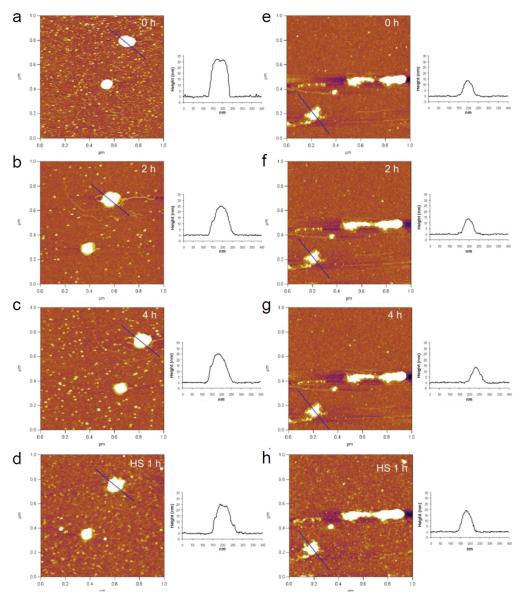
Fig. 4.
In situ AFM images of DNA/L-PEI polyplexes (a-d) and DNA/B-PEI polyplexes (d-h). DNA/L-PEI polyplexes (a-c) and DNA/B-PEI polyplexes (e-g) were incubated in pH 5.0 acetate buffer containing 150 mM NaCl for different periods of time. After exchanging acetate buffer to HS-containing buffer (with 150 mM NaCl), DNA/L-PEI polyplexes (d) and DNA/B-PEI polyplexes (h) were incubated for 1 h. Cross-sectional profiles along the blue lines in the AFM images are represented. All images are 1 × 1 μm2 in scan size and 6 nm in z range.

