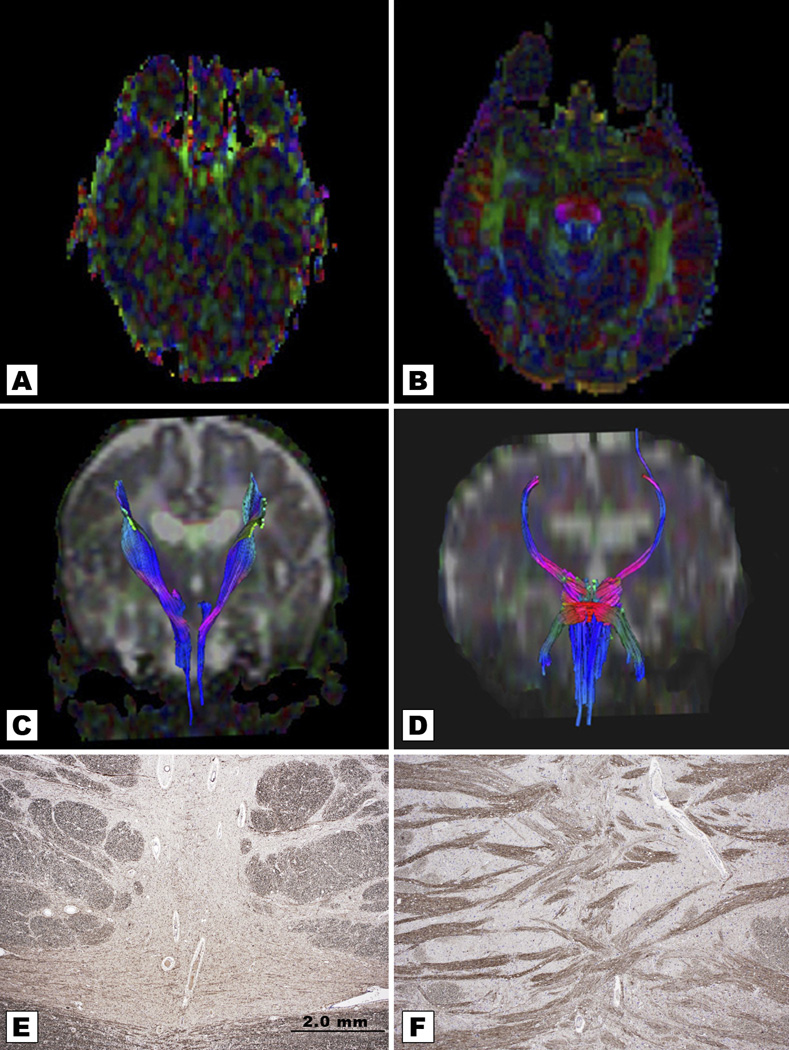
Figure 4.
Comparison of an age-matched control (right) with Twin A at 2.5 months (left). Fractional Anisotropy (FA) axial map of Twin A (Figure A) and coronal tractography (Figure C) outline attenuated corticospinal tracts and absent transverse fibers. FA of the age-matched control (Figure B) shows normal pontocerebellar transverse fibers traveling in X- axis depicted in red color. Coronal tractography map of a normal control (Figure D) outlines normal corticospinal fibers in blue and transverse fibers in red. Note the absent transverse pontine fibers with an axon stain in brainstem neuropathology from a 15-year-old patient with PCH2 (E), compared with normal transverse pontine fibers from an 8-year-old normal control (figures courtesy of Professor Peter G. Barth, Department of Neuropathology, Academic Medical Centre, University of Amsterdam. The Netherlands).

