Figure 3.

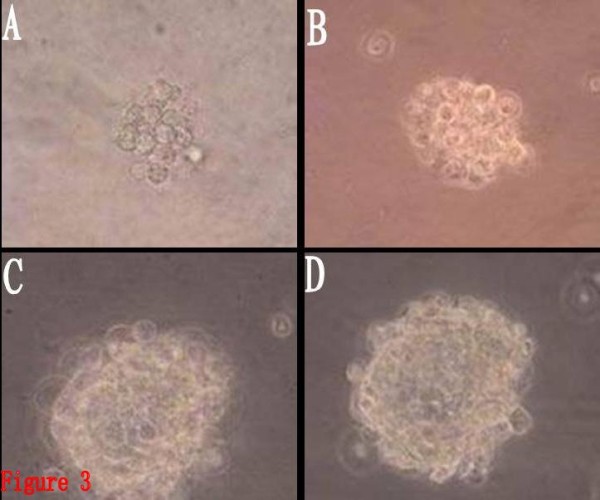
The volume of the cell spheres formed in different group(Inverted phase-contrast microscope, × 400). 2A: the control group. 2B: the ATRA group. 2C: the ATRA/growth factor group. 2D: the growth factor group.

The volume of the cell spheres formed in different group(Inverted phase-contrast microscope, × 400). 2A: the control group. 2B: the ATRA group. 2C: the ATRA/growth factor group. 2D: the growth factor group.