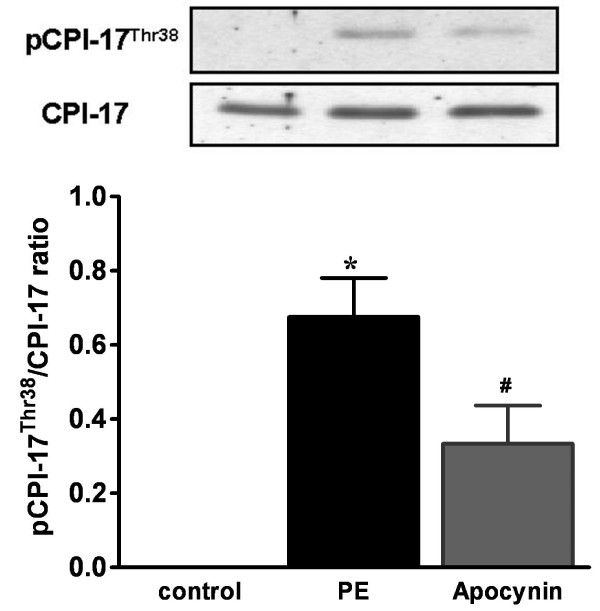
Figure 7.
Effects of apocynin on phenylephrine-induced CPI-17 phosphorylation. RTA strips were incubated with apocynin (3 mM) or vehicle for 30 min and then stimulated with phenylephrine for 1 min. The tissue was snap-frozen and CPI-17 phosphorylation was assessed with CPI-17Thr38 phospho-specific antibody. Equal protein loading was verified by reprobing for total CPI-17 immunoreactivity. The top panel shows the representative blots of phospho-CPI-17Thr38 and total CPI-17. The bottom panel summarizes the densitometric results. The phosphorylation levels of CPI-17 were quantified as the ratio of phosphorylated CPI-17 to total CPI-17 protein. The bars represent means ± S.E.M. of 9 experiments. *p < 0.05 vs. control; #p < 0.05 vs. phenylephrine alone.

