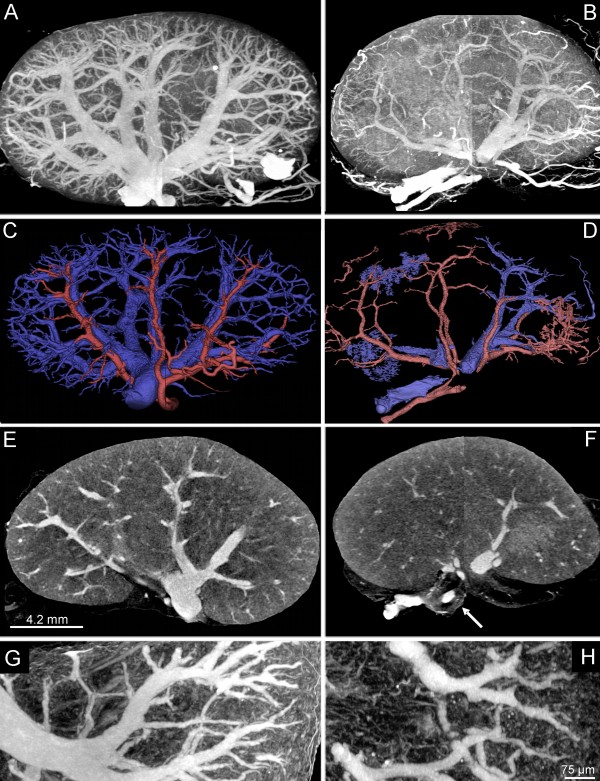
Figure 4.
Quantitative 3D micro-CT imaging. Micro-CT imaging (maximum intensity projection, A, B, G, H; single-slice, E, F) of controls (A, C, E, G) and apoE-/-/LDL-/- double knockout mice (B, D, F, H). Reduced intrarenal vascular volume is present in apoE-/-/LDL-/- double knockout mice at the age of 80 weeks (B, D) compared to controls (A, C). Volume-rendering from controls (C) and double-knockout mice (D) demonstrate the reduced vascular perfusion territories of the intra-renal arterial (red) and venous (blue) vasculature. Nano-CT imaging demonstrates irregular vascular branching with luminal enchroachments in apoE-/-/LDL-/- double knockout mice (F) compared to controls (E).

