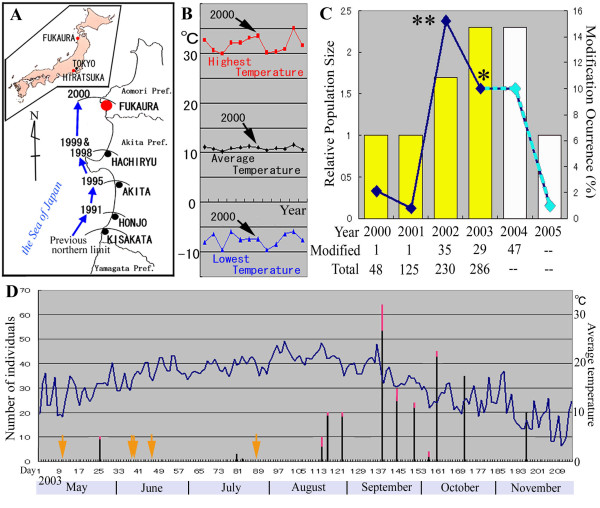
Figure 1.
Field work on Z. maha in Fukaura, Aomori Prefecture, Japan. (A) Range expansion of Z. maha to the north in Honshu Mainland, Japan. Inset shows the locations of Fukaura, Hiratsuka, and Tokyo in the Japanese Islands. (B) Temperature dynamics of Fukaura from 1994 to 2005. Highest (shown in red), average (black), and lowest (blue) temperature records for a given year are indicated. The highest temperature in Fukaura had steadily increased year by year since 1996 until 2000. In 2001, the highest and lowest temperature suddenly dropped. (C) Estimated percentages of the color-pattern modified individuals among the total population of Z. maha in Fukaura (line graph). Relative population size is indicated as bar graph. Asterisks indicate a possible psychological bias. That is, the 2002 data (indicated by double asterisks) may be an overestimate, and the 2003 data (a single asterisk) may be an underestimate. Similarly, for 2004 and 2005, the modification occurrence is connected with broken lines (instead of continuous lines) and the relative population size is indicated by white bars (instead of yellow bars) to indicate the incompleteness of data records for these years. (D) Daily fluctuations of average temperature and the daily occurrence of the modified individuals in 2003. Red portion in a bar indicates the number of modified individuals that were caught, which are mostly from the late August to the early October when temperature is relatively high. Arrows indicate days when the field work was carried out without any Z. maha individual confirmed.

