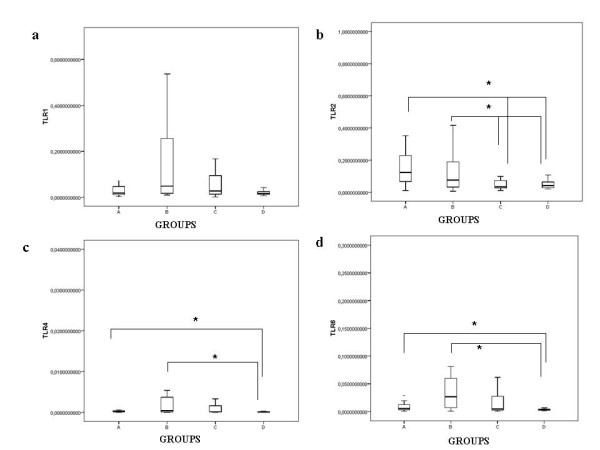
Figure 2.

TLR-1 (a), TLR-2 (b), TLR-4 (c), TLR-6 (d) in fresh unstimulated whole blood in the various groups studied. Data were normalized relative to the endogenous expression of the human acidic ribosomal protein HuPO. There was no significant difference between groups A and B (p > 0.05) in a,b,c, and d. (a)*p < 0.05, for Groups A and B as compared with the uninfected population (groups C and D).
