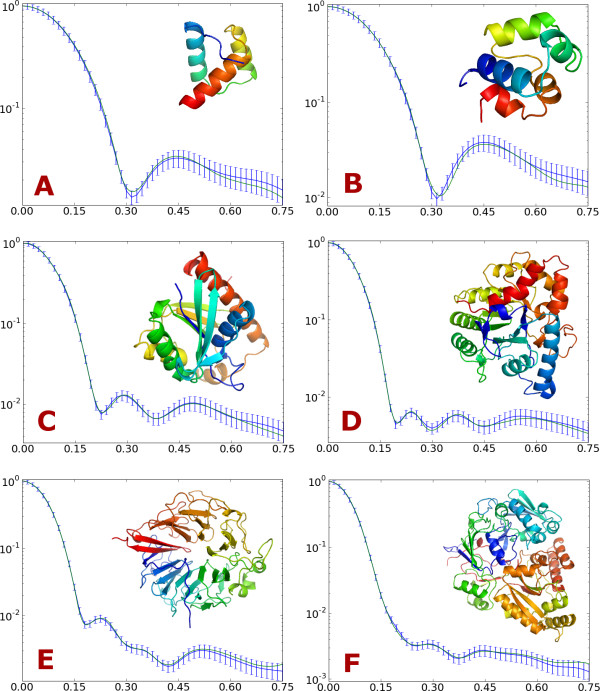
Figure 7.
SAXS curves for six example proteins. Comparison of I(q) calculated by CRYSOL from the all atom structure (blue) and by the two-body model (green). Error bars indicate the simulated "experimental" error for each bin. The example proteins are: (A) 1ENH 54 residues, (B) 2CRO 71 residues, (C) 2PTH 193 residues, (D) 1PTA 327 residues, (E) 1A12 (chain A) 401 residues and (F) 1JET 520 residues.

