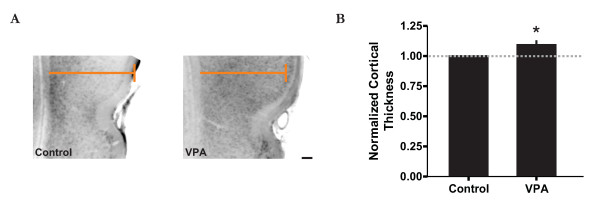
Figure 2.
Enlarged temporal association cortex in VPA-treated animals. A: Images of the TeA area, located dorsal to the rhinal fissure (indent), for both control (left) and VPA-treated animals (right) illustrating an increase in cortical thickness in the latter. Note that the coloured line is identical for both images for reference. Scale bar = 200 μm. B: Normalized cortical thickness measurements of the TeA area between control and VPA-treated animals. * p < 0.05.

