
Figure 8.
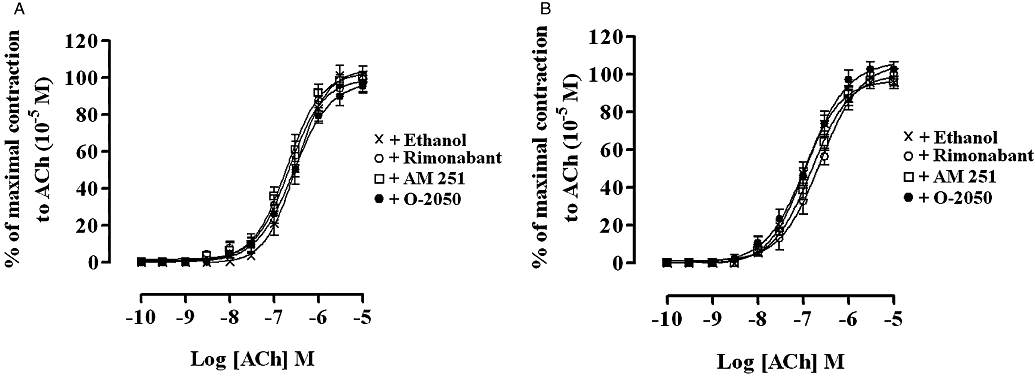
Concentration–response curves for the ACh-evoked contractions of the rat (A) and guinea-pig (B) ileum myenteric plexus-longitudinal muscle in the presence of ethanol, AM 251 (N-(piperidin-1-yl)-5-(4-iodophenyl)-1-(2,4-dichlorophenyl)-4-methyl-1H-pyrazole-3-carboxamide) (10−5 M), rimonabant (N-(piperidino)-5-(4-chlorophenyl)-1-(2,4-dichlorophenyl)-4-methyl-3-pyrazole-carboxyamide) (10−5 M) or O-2050 [(6aR,10aR)-3-(1-methanesulphonylamino-4-hexyn-6-yl)-6a,7,10,10a-tetrahydro-6,6,9-trimethyl-6-H-dibenzo[b,d]pyran] (10−5 M). Each curve was fitted by non-linear regression analysis. The amplitude of the contractions to ACh in the presence of ethanol or a cannabinoid was expressed as a percentage of the maximal contraction to ACh obtained at 10−5 M from an initial ACh concentration–response curve constructed on each tissue. Ethanol or the cannabinoid was added 30 min before constructing the second ACh concentration–response curve; n= 6 for all curves. All values represent mean ± SEM.