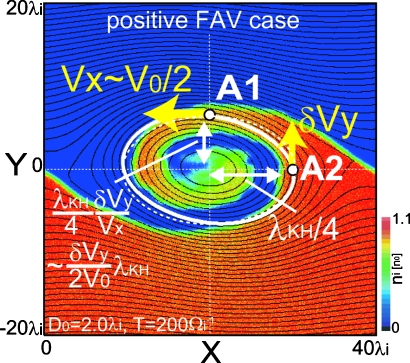
Figure 10.
Density contour at T=200 Ωi−1 for ions which initially exist at Y<0 in the positive FAV and D0=2.0 case. Black lines show the ion streamlines. The white solid line shows a streamline passing through point A2 where δViY and δVeY have a maximum value. At point A1, the white streamline crosses X=20λi. The white dashed line is an ellipse passing through both A1 and A2 points, an approximation of the white streamline.

