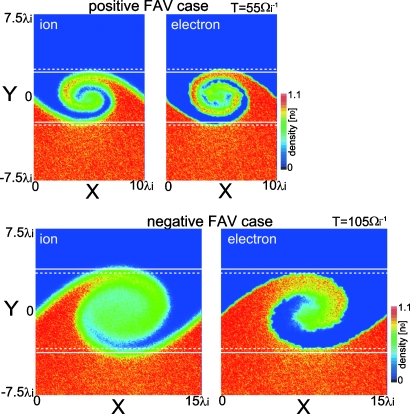
Figure 11.
Density contours at the saturation time of the fastest growing KH mode for ions (left panels) and electrons (right panels) which initially exist at Y<0. The upper and lower panels show the positive and negative FAV cases, respectively, for D0=0.5. Solid (dashed) white lines show the most bulging edges in the Y-direction of the ion (electron) vortex. The edge is marked by the line where the density is half of the peak value near the vortex edge.

