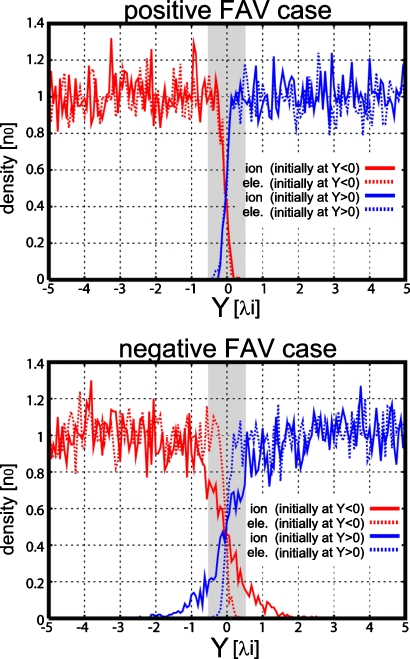
Figure 2.
Density profiles at T=10 Ωi−1 from the simulations for the ion-kinetic scale shear layer case, in which D0=0.5λi∼ρi. Upper (bottom) panels show the results from the positive (negative) FAV case. Density of particles which initially exist in the Y>0 (Y<0) region are shown separately. Solid (dashed) lines show the ion (electron) density.

