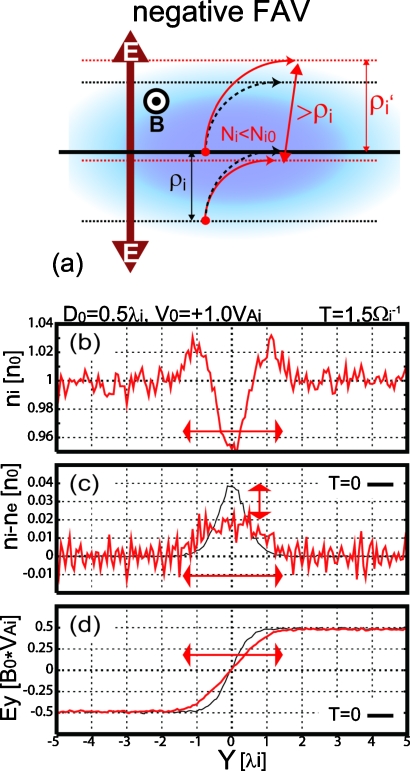
Figure 5.
(Upper) Illustration of representative orbits of ions, one crossing and the other moving toward the center of the shear layer, from the initial state until a quarter of ion gyroperiod in the negative FAV case (red solid arrows) and no shearing flow case (black dashed arrows). (Below) Profiles at T=1.5 Ωi−1 (∼a quarter of ion gyroperiod) of ion density (b), difference between ion and electron densities (c), and electric field EY component (d) in the D0=0.5 and negative FAV case. Narrow lines in Figs. 5c, 5d show initial profiles of (ni−ne) and EY, respectively.

