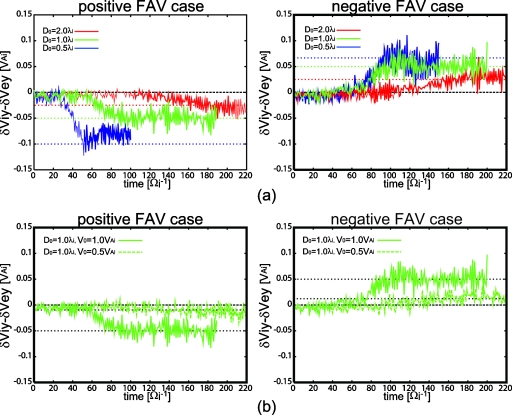
Figure 9.
Difference δViY−δVeY as a function of time in the positive FAV (left) and negative FAV (right) cases. (a) The vortex size dependence in which D0=2.0, 1.0, and 0.5 cases are compared for V0=1.0VAi. (b) The shearing flow speed dependence in which V0=1.0 and 0.5 cases are compared for D0=1.0. Dotted lines show the theoretical values obtained from Eq. 10.

