Fig. 3.
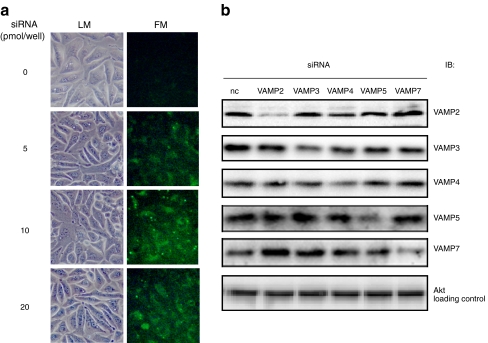
Transfection and knockdown of genes encoding VAMP isoforms. a HL-1 cells were transfected with different concentrations of fluorescence-labelled siRNA 24 h after seeding. Transfection efficiency was microscopically determined 6 h after transfection by assessment of the incorporated fluorescence. b HL-1 cells were transfected with siRNAs against VAMP2–8 24 h after seeding. After a further 48 h, cells were lysed and the lysates separated by SDS-PAGE and subsequently blotted for each VAMP isoform. Protein kinase B/AKT (AKT) served as a loading control. Representative western blots are shown. FM, fluorescence microscopy; LM, light microscopy; nc, non-coding; IB, immuno blot

