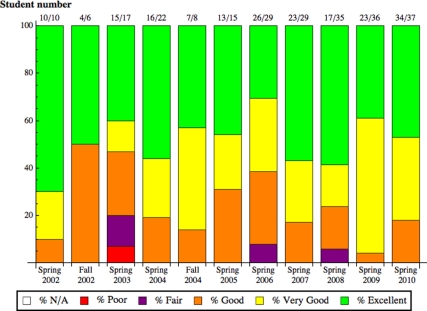
Figure 6.
Student evaluations of the course. The fractions at the top of each bar indicate the number of students who provided evaluations over the total number of students in the course that semester. For example, in spring 2008, only 17 of the 35 students in the course provided evaluations (interestingly, this corresponded to the year in which CWRU switched from paper forms that were filled out in class to online evaluations that students could fill out at any time). Compliance was higher in 2010 (34/37) when the instructors repeatedly requested that students fill out the evaluations before the deadline.

