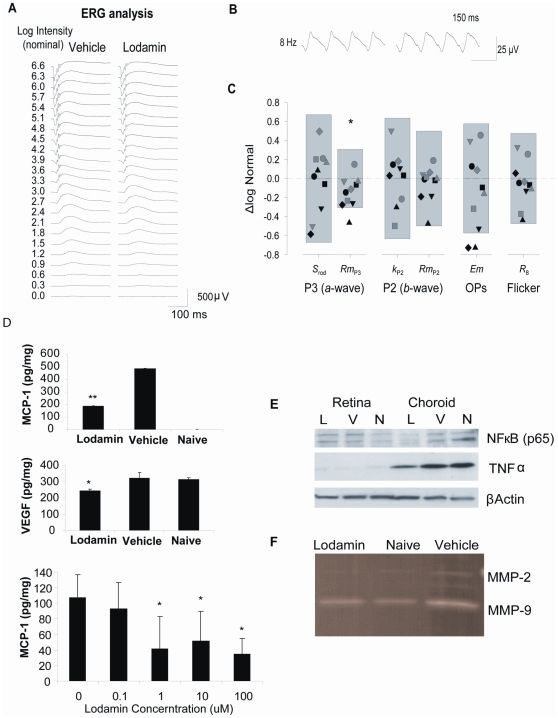
Figure 6. Retinal ERG and protein analysis post Lodamin treatments.
Effects of intravitreal Lodamin on retinal function. (A) Representative full-field flash ERG responses from the eyes of mice 14 days after intra-ocular injection of vehicle (left) or 300µg /eye Lodamin (right). (B) Representative responses to 8 Hz flicker (C) The 5th to 95th prediction limits for ERG parameters in vehicle treated rats are shown; the dashed line represents the normal mean of all the paramters. Symbols are parameters values of individual Lodamin-treated mice, and represent the same mouse in each column. Data are ΔLogNormal (eq. 3). Only the saturating amplitude of the rod photoresponse (Rm P3) differed significantly after Lodamin. (D) Effect of oral Lodamin treatment on protein levels of pro-angiogenic and pro-inflammatory factors. (D) Levels of MCP-1 and VEGF extracted from whole eye tissues from naïve mice, mice treated with Lodamin (30mg/kg, oral every day for 7 d) or vehicle (same equivalent amount of mPEG-PLA micelles). Data of ELISA assay are presented as a mean of pg/ml concentration ± SD (n = 6, * P<0.05, t-test). Bottom: ELISA quantification of secreted MCP-1 from RPE to the medium post 24 h incubation with Lodamin at different doses (0.1–100 nM TNP-470 equivalent). (E) Western blot protein analysis of samples of tissue lysis of retina or choroid of the different treatment groups: N = naïve mice, V = vehicle treated mice, L = Lodamin treated mice. Factors detected are TNFα (26 kDa) (F) Zymogram showing MMP-2 and MMP-9 activity in ocular tissue following oral Lodamin treatment of mice (30 mg/kg/day 7 days).

