
Figure 1.
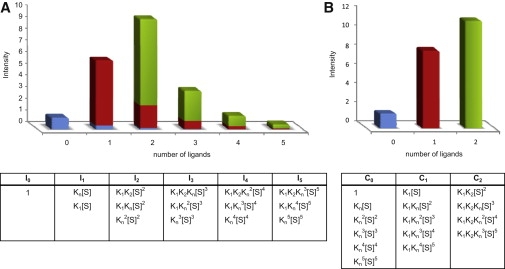
An illustration demonstrating the calculated specific and nonspecific components that contribute to the peak intensities of the 19+ charge state in the case of a solution containing 4 μM CK and 50 μM ADP. (A) Histogram showing the experimentally observed intensities corresponding to the different ligand-bound states. Both specific and nonspecific binding are reflected in each intensity. (B) A histogram generated after correcting for the contribution of nonspecific binding, so that the intensities reflect only specific binding. Listed below each intensity are the factors that contribute to it. The intensities are normalized with respect to I0. The relative contributions of the free protein and protein bound with one or two ligand molecules at the specific sites before (A) and after (B) the correction are indicated in blue, red, and green, respectively.