
Figure 3.
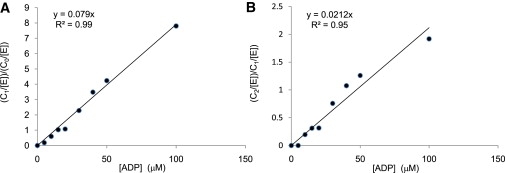
Determination of the values of K1 (A) and K2 (B) by plotting (CN/[E])/(CN−1/(E])) versus [S] and fitting the data using Eq. 10, where [S] is the ADP concentration. Each data point is calculated from the average of the three observed charge states (18+, 19+, and 20+) in four independent experiments.