
Figure 2.
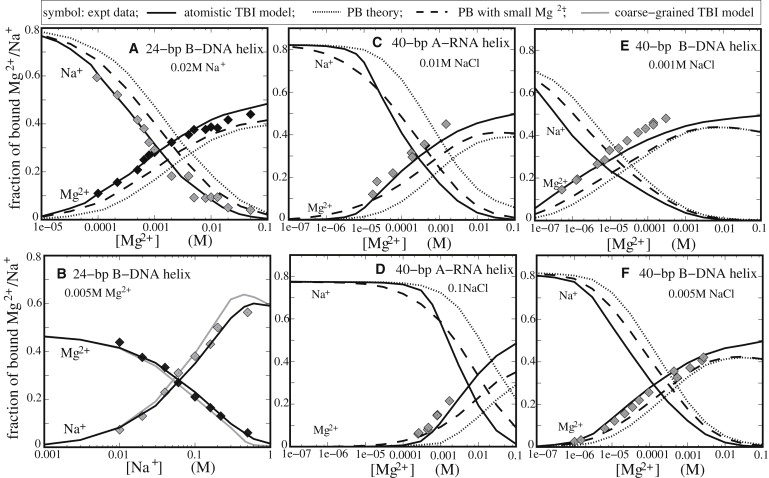
The Mg2+ and Na+ binding fractions per nucleotide for oligomeric DNA and RNA helices as functions of [Mg2+] or [Na+]. (Symbols) Experimental data. (Solid lines) Atomistic TBI predictions. (Dotted lines) PB predictions. (Dashed lines) PB predictions with a smaller Mg2+ radius (≃3.5 Å). (Shaded lines) TBI predictions on a coarse-grained DNA duplex. (A) A 24-bp B-DNA duplex in 20 mM Na+ (28,63). (B) A 24-bp B-DNA duplex in 5 mM Mg2+ (28,63). (C and D) A 40-bp RNA duplex in 10 mM [Na+] and 100 mM [Na+], respectively. The experimental data are for poly(A.U) (64). (E and F) A 40-bp DNA duplex in 1 mM [Na+] and 5 mM [Na+], respectively. The experimental data are for calf thymus DNA (65).