
Figure 4.
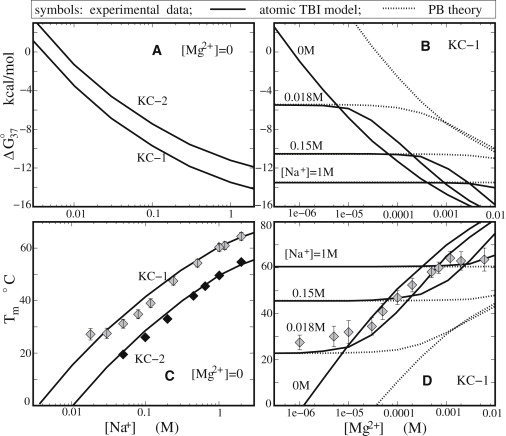
The free energies ΔG37 (A and B) and melting temperature Tm (C and D) as functions of the Na+ concentration (A and C) and the Mg2+ concentration (B and D). (C) The experimental data for KC-1 and KC-2 are from Weixlbaumer et al. (49) and Lorenz et al. (50), respectively. (D) The experimental data are from Weixlbaumer et al. (49). (Solid lines) TBI predictions. (Dotted lines) PB predictions.