
Figure 3.
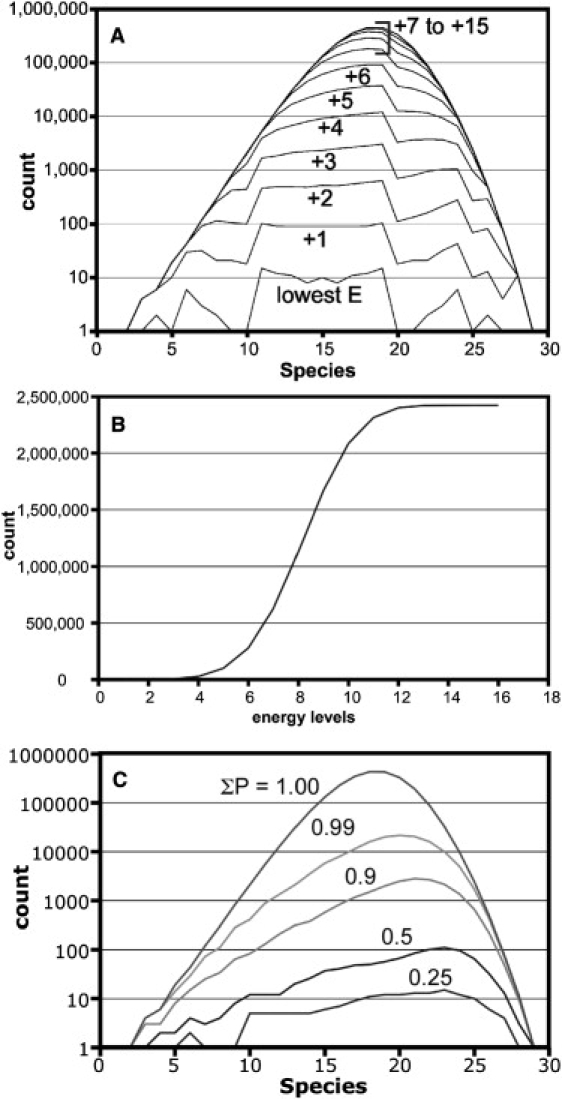
Parsing intermediates by stability and probability. (A) A histogram of intermediates, analogous to Fig. 2 but on a log scale and with individual lines based on stability—the number of intersubunit contacts in a given intermediate. There are as many as 15 energy levels. There are only 141 species in the lowest energy level of 2.4 million total species. (B) Only a small fraction of species are in the lowest four energy levels. (C) A histogram of species (as in A) based on the probability of intermediates. The probability here is calculated based on the total population, where each intermediate makes only a very small contribution to the total.