
Figure 2.
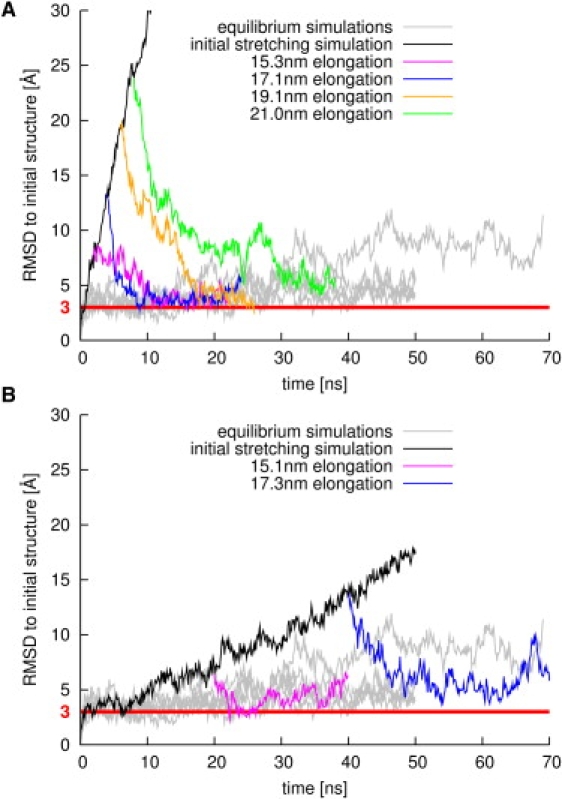
Backbone RMSD, with respect to the initial structure of yImpβ during stretching (black lines) and subsequent release (magenta, blue, orange, and green lines). For comparison, gray lines display data from equilibrium simulations. (Red horizontal line) RMSD value of 3 Å. (A) Stretching at 1 m/s and subsequent release at different elongations. (B) Stretching at 0.1 m/s and subsequent release at different elongations.