
Figure 4.
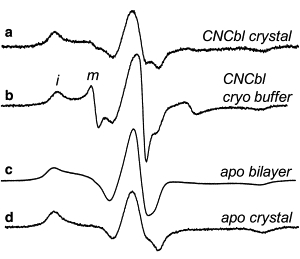
EPR spectra from BtuB-V10R1 with bound ligand in (a) the protein crystal, (b) in the crystallization buffer at a protein concentration too dilute to form crystals, and in the apo state in (c) lipid bilayers and (d) the protein crystal. The symbols i and m indicate immobilized and mobile components in the spectra for panel b. The spectrum in panel c is identical to the spectrum in Fig. 2a, except that the small mobile component seen in Fig. 2a has been subtracted. All spectra are 100 Gauss scans.