
Figure 1.
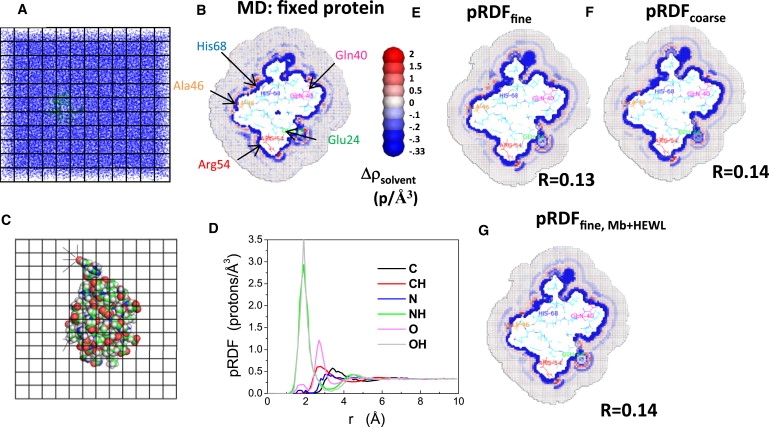
Calculating solvent density around Ub using pRDFs. (A and B) The average solvent density around Ub is obtained from MD simulations with the protein atoms fixed. An 8 Å grid spacing is shown in panels A and C, but 0.5 Å is used in the calculations. Density is defined as protons per Å3. (C and D) Using these data, the pRDFs are calculated by identifying the nearest solute atom and distance to each grid element; for example, the oxygen atom (red, upper left) is the closest solute atom to four grid elements (denoted with lines). (E and F) Solvent density calculated by reversing the mapping protocol using the pRDF calculated for the fine and coarse atom type definitions. R-values are listed. The color scale is asymmetric, and hence, noise tends to make the bulk solution appear blue. (G) Solvent density calculated using the averaged pRDFs obtained from Mb and HEWL using the fine atom-type definition. Only one cross-sectional layer of cubes is shown but protein atoms within 3 Å of the layer are displayed. Thus, some proteins atoms can be seen above the slab. Note p = electrons.