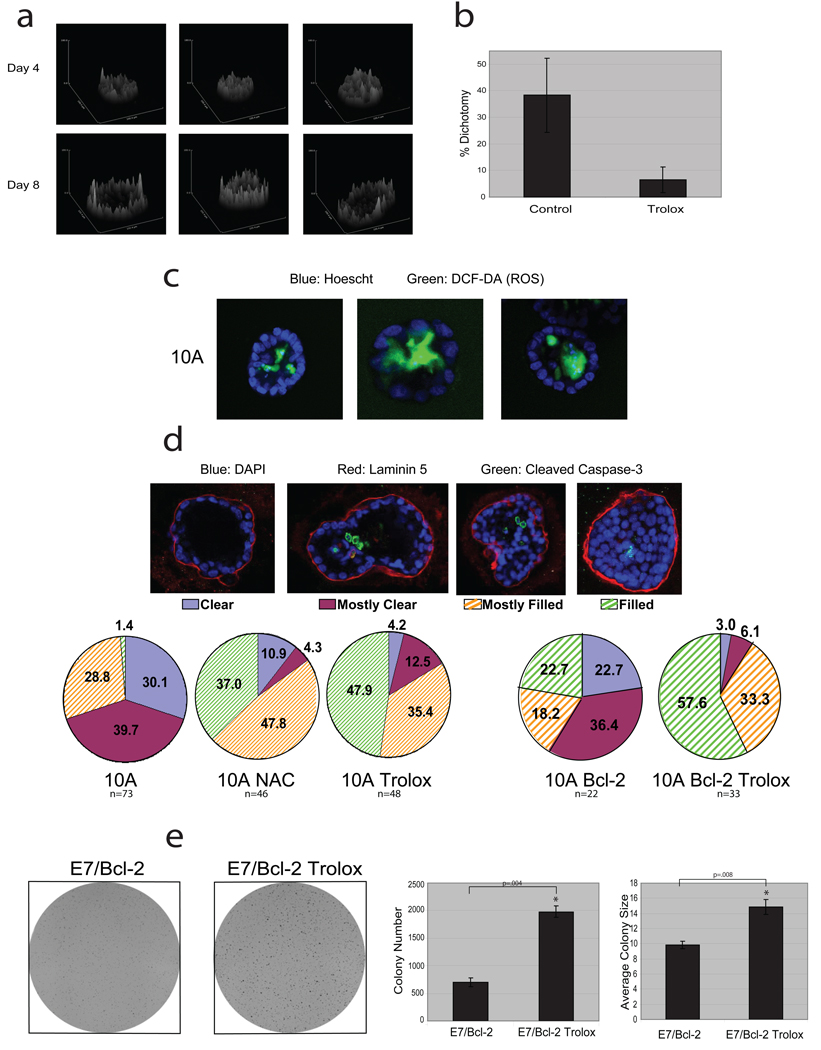
Figure 4. Analysis of antioxidant effects on acinar morphogenesis and colony formation in soft agar.
(a) Native fluorescence of NAD(P)H was assayed by two-photon microscopy in MCF-10A acini. Surface intensity plots of three representative structures from Day 4 or Day 8 are shown. (b) Native fluorescence of NAD(P)H was assayed by two-photon microscopy in MCF-10A acini cultured in the presence or absence of 50 µM Trolox (added daily). At Day 8, structures were blindly scored for dichotomy in fluorescent intensity based on evidence of a reduction in fluorescence intensity in the inner cells (see examples in Supplementary Fig. 14). Error bars represent standard deviation of individual scorings (n=5). (c) ROS was measured in MCF-10A acini at Day 7, by staining with 25 µM DCF-DA (green) and Hoescht (blue). Three representative images are shown and 41% (n=73) of all structures were positive for DCF-DA staining exclusively in the inner cells. NAC or Trolox treatment inhibited the DCF-DA staining in acini (data not shown). (d) Acini were formed using 10A or Bcl-2-MCF-10A cells (10A or 10A Bcl-2) and treated with 1 mM NAC or 50 µM Trolox where indicated. At Day 19 (10A) or Day 33 (Bcl-2), acini were stained for laminin 5, cleaved caspase-3, and with DAPI. Acini were then scored as described. (e) 10A cells expressing E7 and Bcl-2 were plated in soft agar and after 20 days, images were taken after INT-violet staining. Colony number and average colony size were determined using ImageJ. Error bars represent standard deviation (n=3 unless otherwise indicated). A * represents a statistically significant change calculated using a 2 tailed t test.

