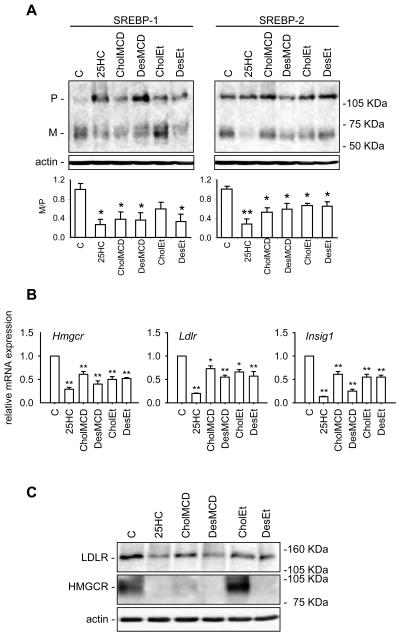
Figure 4.
Effect of 25HC, cholesterol and desmosterol on the SREBP pathway in sterol deprived J774-D cells. Cells were incubated in DCCM-1 supplemented with 1% HPCD, 2.5 μM lovastatin and 100 μM mevalonate for 1 h. Then, cells were switched to the same medium but without HPCD and containing or not (control, C) 0.5 μg/mL 25HC dissolved in ethanol, 11.6 μg/mL cholesterol (CholMCD) or desmosterol (DesMCD) complexed with MCD or 25 μg/mL cholesterol (CholEt) or desmosterol (DesEt) dissolved in ethanol, and incubated for additional 5 h. (A) Western blot analysis of SREBP-1 and SREBP-2 processing. Fifty μg of protein were subjected to SDS-PAGE electrophoresis. The precursor and mature form of SREBPs are denoted P and M, respectively. The results correspond to a representative experiment out of three. Lower panels represent the ratio between the respective optical densities of M and P bands; the ratio obtained for the control condition has been arbitrarily defined as 1. Bars show the mean and whiskers indicate the SEM of data from three experiments. *, P<0.05; and **, P<0.01 vs. the control condition by paired t-test. (B) Hmgcr, Ldlr and Insig1 mRNA levels. The results are expressed as the relative amount of mRNA compared to the level in control condition without sterol. Bars show the mean and whiskers indicate the SEM of data from three experiments. *, P<0.05; and **, P<0.01 vs. the control condition by paired t-test. (C) Western blot analysis of HMG-CoA reductase and LDLR protein levels. Fifty μg of protein were subjected to SDS-PAGE electrophoresis. The results correspond to a representative experiment out of three.

