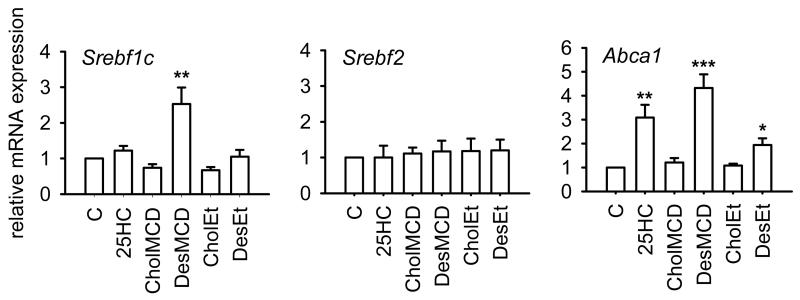
Figure 5.
Effect of 25HC, cholesterol and desmosterol on Srebf1c, Srebf2 and Abca1 mRNA levels in sterol deprived J774-D cells. Cells were treated as described in Figure 4. The results are expressed as the relative amount of mRNA compared to the level in control condition without sterol (C). Bars show the mean and whiskers indicate the SEM of data from three experiments. *, P<0.05; **, P<0.01; and ***, P<0.001 vs. control condition by paired t-test.

