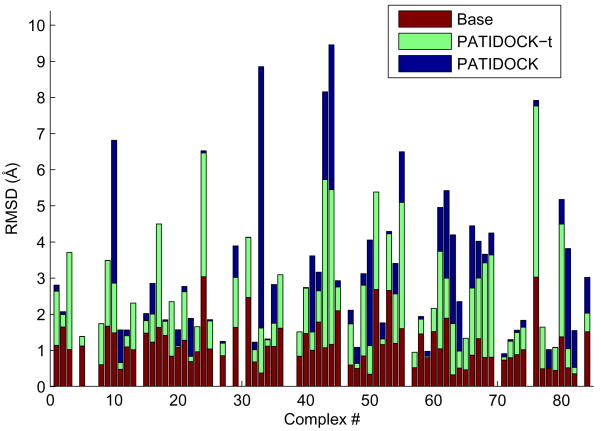
Figure 7.
The results of PATIDOCK-t (green bars) and PATIDOCK (blue bars) assembly of complexes of “unbound” structures of the proteins from the COMPLEX dataset, using synthetically generated alignment tensors from the corresponding “bound” complexes as the target experimental alignment tensor to guide the docking. Shown are backbone RMSDs between the resulting (unbound) complex and the original (bound) complex. “Base” RMSDs (red bars) reflect the structural differences between the unbound and bound structures of the individual domains, calculated by superimposing the unbound structure of each domain onto the bound structure in the complex and computing the overall RMSD. Missing bars correspond to those few complexes where we were unable to properly match the atoms between the bound and the unbound coordinate sets.

