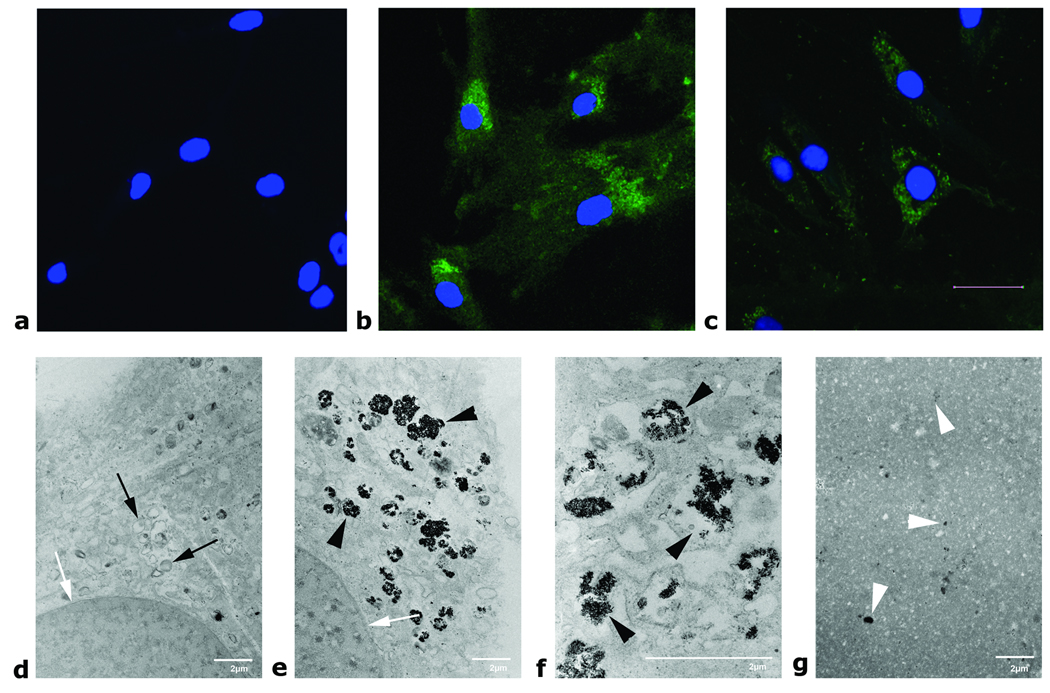
Figure 2.
Upper row: Confocal microscopy of unlabeled hMSC (a) as well as 1 day (b) and 4 weeks (c) after labeling with Ferucarbotran. Cells were stained with an anti-dextran FITC antibody (green) and the nucleus was counterstained with DAPI (blue). Four weeks after labeling, the dextran coating of the contrast agent particles could still be stained. The stronger staining immediately after labeling (b) suggests a higher intracellular concentration of the contrast agent particles. Scale bar corresponds to 20 µm. Lower row: Electron microscopy of hMSC: Unlabeled controls (d, 4100×), labeled hMSC (e, 4100× and f, 12500×) showing the contrast agent within lysosomes, lysed hMSC (g, 3600×, diluted 1:10 in gelatin). White arrows indicate the nucleus; black arrows show normal lysosomes; black arrowheads show contrast agent filled lysosomes. Note the total absence of intracellular compartments and the even distribution of free contrast agent after cell lysis in g (white arrowheads). Scale bars correspond to 2µm.

