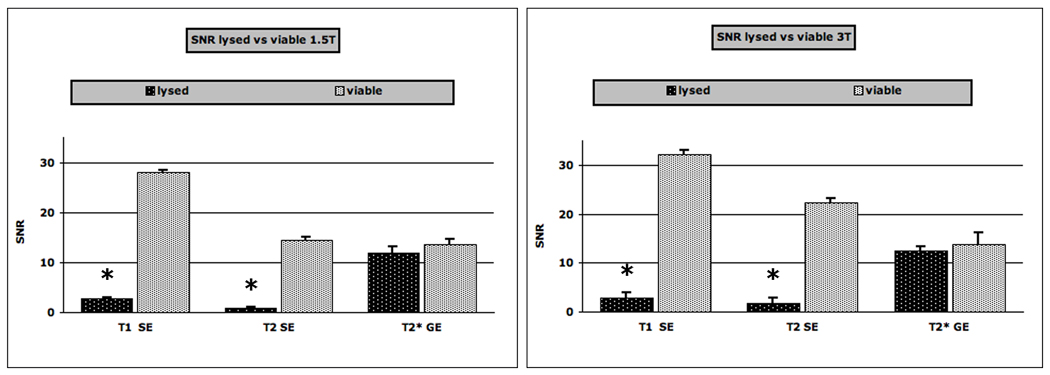
Figure 4.
Signal-to-noise-ratios (SNRs) of viable and lysed Ferucarbotran labeled hMSCs, scanned at 1.5T (left graph) and at 3T (right graph). Data are displayed as means and standard deviations. Note the lower SNR of lysed samples compared to viable hMSCs on T1 and T2-weighted SE images (TR 500/ TE 15 and 4000/45 respectively) and the similar SNR of lysed and viable cells on T2*-weighted GE (500/3.7) images. The asterisk indicates a significant difference for SNR between viable and lysed samples.

