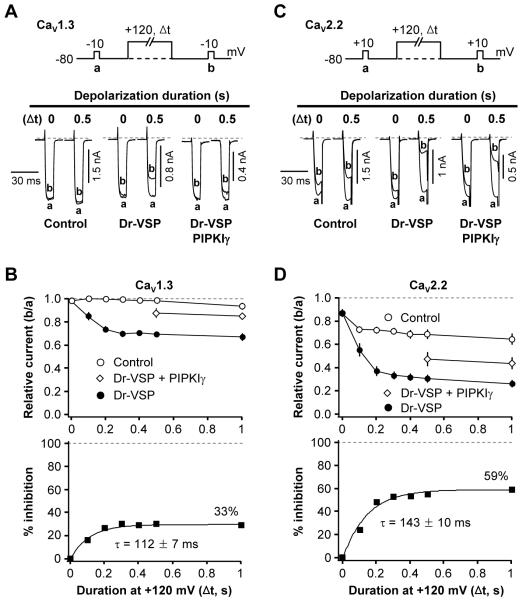
Figure 2. Inhibition of CaV Currents by Dr-VSP-Mediated PIP2 Depletion.
(A and C) Typical traces of CaV1.3 (A) and CaV2.2 (C) currents before and after activation of Dr-VSP by depolarizations to +120 mV. Cells without Dr-VSP (Control), cells transfected with Dr-VSP, or cells transfected with Dr-VSP plus PIPKIγ received a test pulse to −10 (A) or +10 mV (C) for 10 ms and then were depolarized to +120 mV for zero or 0.5 s (as marked), followed by a second test-pulse. The currents before (a) and after (b) the +120 mV-depolarizing pulse are superimposed. Dashed line is zero current.
(B and D) Time-dependent inhibition of L-type (CaV1.3, B) and N-type (CaV2.2, D) currents by Dr-VSP activation. Top, cells were depolarized to +120 mV for various times and the relative current ratio (b/a) was measured in control (open circle, n = 6-14 for CaV1.3 and n = 6 for CaV2.2), Dr-VSP-expressing (closed circle, n = 6-11 for CaV1.3 and n = 6 for CaV2.2) cells, and Dr-VSP plus PIPKIγ expressing cells (n = 5-8). The delay between subsequent test pulses was 1 min. Bottom, percent inhibition of currents by time-graded activation of Dr-VSP at +120 mV. See formula in text. The current inhibition by 1-s depolarizing pulse is labeled in each figure. See also Figure S2.

