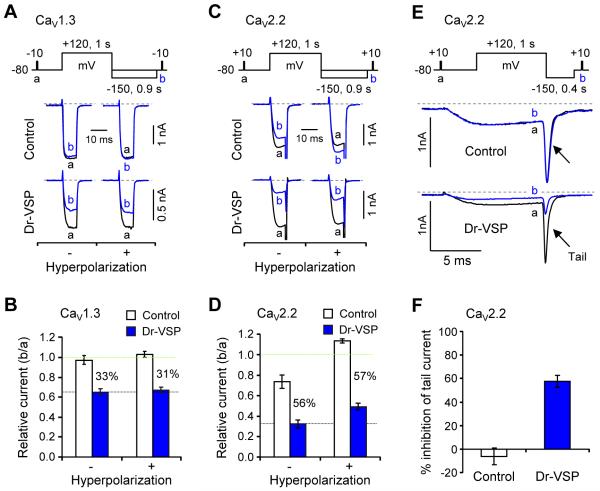
Figure 3. Channel Inhibition by Dr-VSP Corrected for VDI.
(A and C) Effect of membrane hyperpolarization on Dr-VSP-induced inhibition of CaV1.3 (A) and CaV2.2 (C) currents. The changes of CaV1.3 and CaV2.2 currents by a +120-mV depolarizing pulse were measured without (−) and with (+) a hyperpolarizing step (−150 mV, 0.9 s) in control and Dr-VSP-expressing cells. Pairs of current traces were recorded from the same cell with a 1-min interval.
(B and D) Summary of the relative peak current (b/a) of CaV1.3 (B) and CaV2.2 (D) in control and Dr-VSP-expressing cells with and without the hyperpolarizing step. Data are mean ± SEM (CaV1.3, n = 5 - 6; CaV2.2, n = 4). The percent difference between control and Dr-VSP is labeled in each condition.
(E) Effect of Dr-VSP on CaV2.2 tail currents. Tail currents were measured with a hyperpolarizing step (−150 mV, 0.4 s) in control and Dr-VSP-expressing cells. Pairs of current traces were recorded from the same cell 1 min apart. Capacitive and leak currents were subtracted by a P/5 procedure.
(F) Summary of the tail-current inhibition (%) of CaV2.2 in control and Dr-VSP-expressing cells. Data are mean ± SEM (control, −6.1 ± 7.2, n = 5; Dr-VSP, 57.6 ± 5.2, n = 8).

